
Where Clipper’s LP Returns Come From


Because Clipper’s FMM design is novel, it generates LP yields differently than other DEXs. To understand where Clipper’s LP returns come from, one must first understand modern portfolio theory (MPT), how MPT informed Clipper’s architecture, and how that structure performs in practice. Let’s break it down:
Modern Portfolio Theory & the Diversified Rebalancing Portfolio
It is a generally accepted principle in investing that the optimal way to gain exposure to an asset class or sector is through a diversified rebalancing portfolio. Modern Portfolio Theory states that a portfolio of multiple assets typically results in better returns at a lower level of risk than investing solely in any one asset. In a well-diversified portfolio, the individual risk of each asset contributes little to the overall portfolio risk. Instead, their volatility can actually offset each other, reducing overall portfolio risk. The set of optimal portfolios that offer the highest expected return for a given level of risk defines the efficient frontier of portfolios. These portfolios are composed of individual candidate assets with a target weight set for each one. Over time, changes in market prices drive a deviation from these target weights, which triggers a rebalancing.
For example: Many financial advisors recommend a classic personal portfolio of 60% stocks and 40% bonds. If stocks rise 10% in value and bonds fall 10%, the portfolio will become 62%/38%. Rebalancing then occurs by selling stocks to buy bonds until the 60%/40% target composition is re-established.
This rebalancing process is incredibly important because it delivers substantial additional returns on its own. In other words, a rebalancing portfolio can outperform a static (”held”) portfolio consisting of any initial combination of the assets themselves. This is because rebalancing is equivalent to systematically ‘buying low and selling high’, thereby increasing allocation to risky assets as their price falls and selling them as their price rises. As long as there is sufficiently more short-term volatility relative to long-term volatility (which is generally the case), rebalancing harvests additional profits. This is a well researched phenomenon that earned Harry Markowitz the Nobel Prize in Economics in 1990.
The Daily Rebalancing Portfolio (DRP)
Rebalancing portfolios perform best when there is high short-term volatility relative to long-term volatility. This is often the case with crypto blue chips. Because short-term mean reversion is so empirically well-documented and crypto regularly exhibits high short-term volatility, the optimal rebalancing frequency for crypto is very short, at least daily.
If frequent rebalancing is such an obvious source of yield, why don’t we see it more often in TradFi? Because, in practice, rebalancing is expensive. Every time a portfolio is rebalanced, it pays transaction costs which usually end up dragging yields down as much as rebalancing drives them up. Thus, we often observe quarterly rebalancing portfolios and rarely daily rebalancing portfolios. If transaction costs weren’t part of the equation, we would probably see frequently rebalanced portfolios everywhere in financial markets. And in crypto, we’d see the DRP.
If you want to learn more about rebalancing portfolios and how they perform in various environments, here are some third-party resources and academic research:
- Portfolio Rebalancing: A Stable Source of Alpha
- Investor's Alpha: Systematic Portfolio Rebalancing
- Optimal Rebalancing: A Scalable Solution
- A Mathematical and Empirical Analysis of Rebalancing Alpha
- Cover’s original 1991 work on “Universal Portfolios”
- Follow-up work on how universal portfolios are affected by transaction costs.
How Clipper’s Liquidity Pools Function
Clipper’s pools were designed with modern portfolio theory in mind; they’re built to track the benchmark of a theoretical zero-cost DRP.
On each chain, Clipper has one multi-asset pool composed of WBTC, ETH, USDC, USDT, DAI, and sometimes others (varies by chain). Each asset has a target weight, which is based on its trading volume and volatility. On Ethereum mainnet, the targets are roughly ⅓ WETH, ⅓ WBTC, and ⅓ USD stablecoins. LPs who deposit into a pool own a pro-rata portion of the entire pool, not just the asset(s) they deposited. This means the real-time value of an LP’s deposit will fluctuate based on the (USD-denominated) value of the entire liquidity pool. It means Clipper LPs have acquired exposure to a diversified portfolio on the efficient frontier of return relative to risk.
Clipper’s innovation is in the rebalancing process. Instead of paying transaction fees to buy and sell, Clipper facilitates swaps at advantageous prices with the noisy order flow from retail traders (noisy i.e., randomly distributed around the actual market price). Thus, transaction costs are paid for by traders rather than LPs. Clipper ensures noisy flow by only transacting with human traders, deterring over-informed whales, and banning bots. Because Clipper maintains smaller liquidity pools (it sustains TVL levels that achieve an optimal balance of fees and slippage for small trades), volume turns over extremely fast, sometimes multiple times per day. This means Clipper can rebalance pools quickly just by using its organic trade flow. The alpha generated from the zero-cost DRP is the entire source of Clipper’s yield. There are no “fees” like we see with first generation DEXs.
Note that the intention behind this design was actually to benefit traders, not just LPs. The more efficiently LPs can earn yield, the lower the fees for traders. It’s no coincidence that the best prices come from the pool with the best yields; the best yields enable the best prices. It’s a win-win.
Clipper in Practice
Theory is nice, but actual performance is what matters. Let’s see how Clipper stacks up against its benchmark. Observe that this is a lofty goal: Clipper’s benchmark is not practically achievable and real-world attempts to track it (e.g., with a derivative) would carry a hefty fee premium.
If we look at Clipper’s performance from September 11, 2022 to October 10, 2022 (which includes the “ETH Merge” event), we see that ETH fell more than 20% in price, while Bitcoin lost closer to 5% of its value. ETH’s large price drop is why both portfolios lost money (in dollar terms) over this interval.
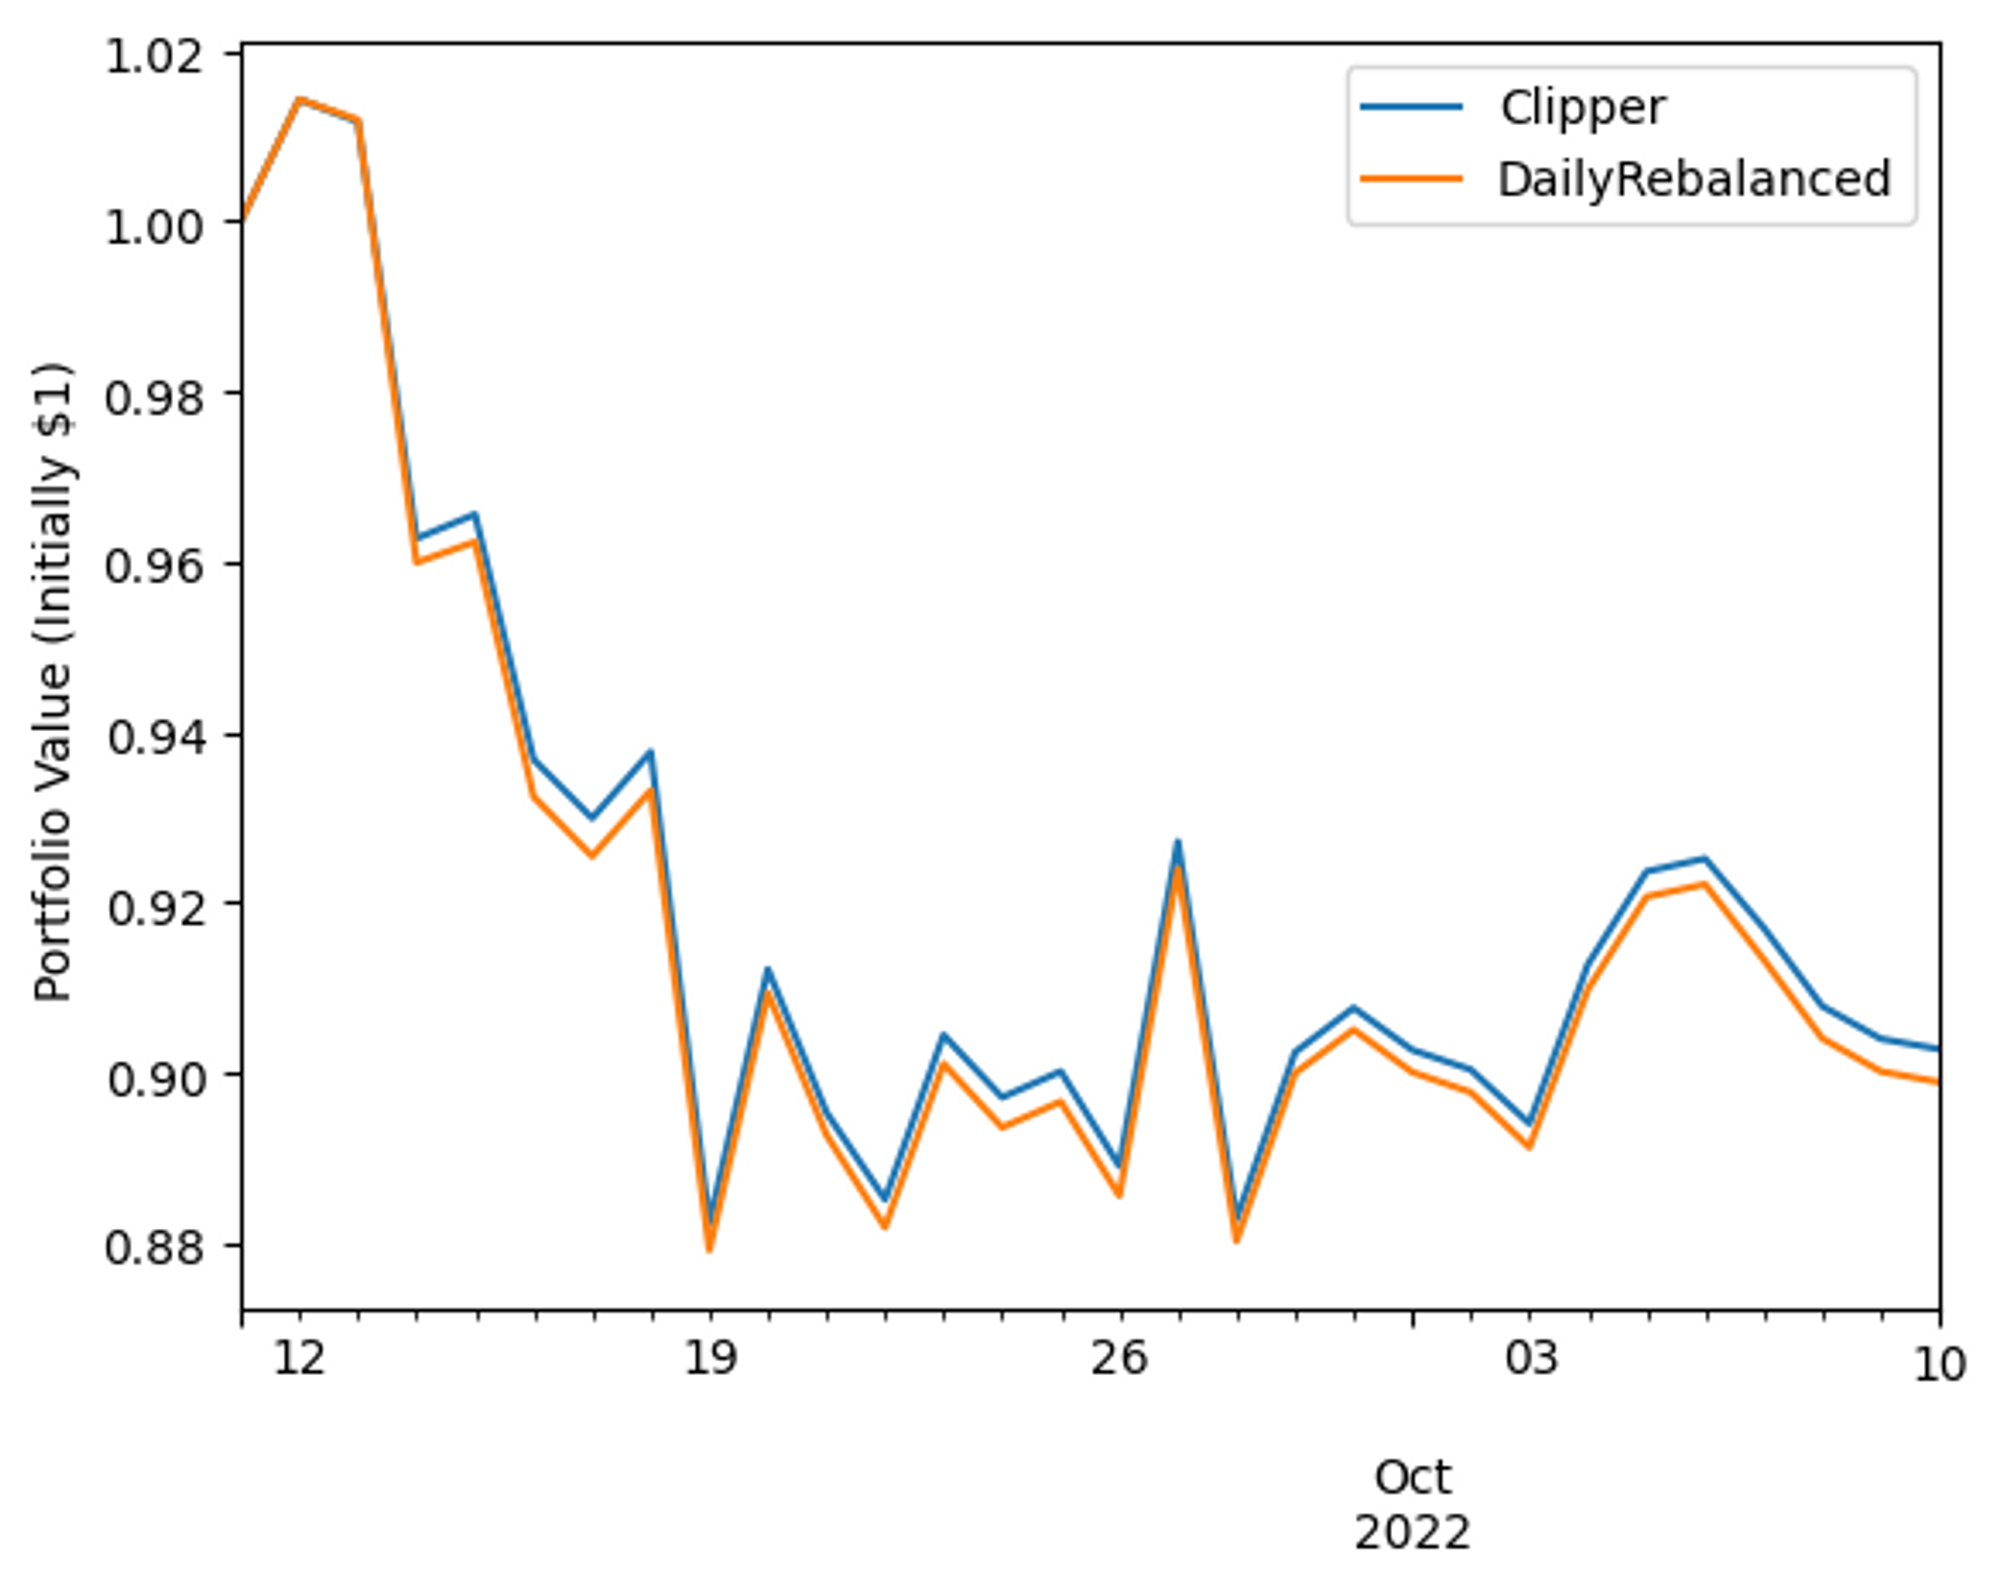
Overall, Clipper closely tracks the DRP while staying slightly ahead of it, finishing the interval almost 40 basis points ahead of the benchmark. Clipper was within one basis point of the benchmark for more than three-quarters of days in the period. For those days where Clipper LP and the benchmark diverged by more than one basis point, Clipper was ahead of the benchmark more than two-thirds of the time (23% vs 10% of days).
The reason for return divergence is that Clipper’s Formula Market Maker will make trades continuously with traders over the course of a day, while the theoretical Daily Rebalanced Portfolio is simulated to costlessly rebalance once each day. Despite the divergences, the daily correlation of percent returns to the returns of the Daily Rebalanced Portfolio was extremely high at ρ = 0.9996.
In addition, Clipper “fees” are an adjustable parameter that can be adjusted in response to volatility.
How Clipper compares to First Generation DEXs
The first generation of DEXs, like Uniswap and Curv, work differently than Clipper. This is perhaps surprising because they do appear to be diversified portfolios.
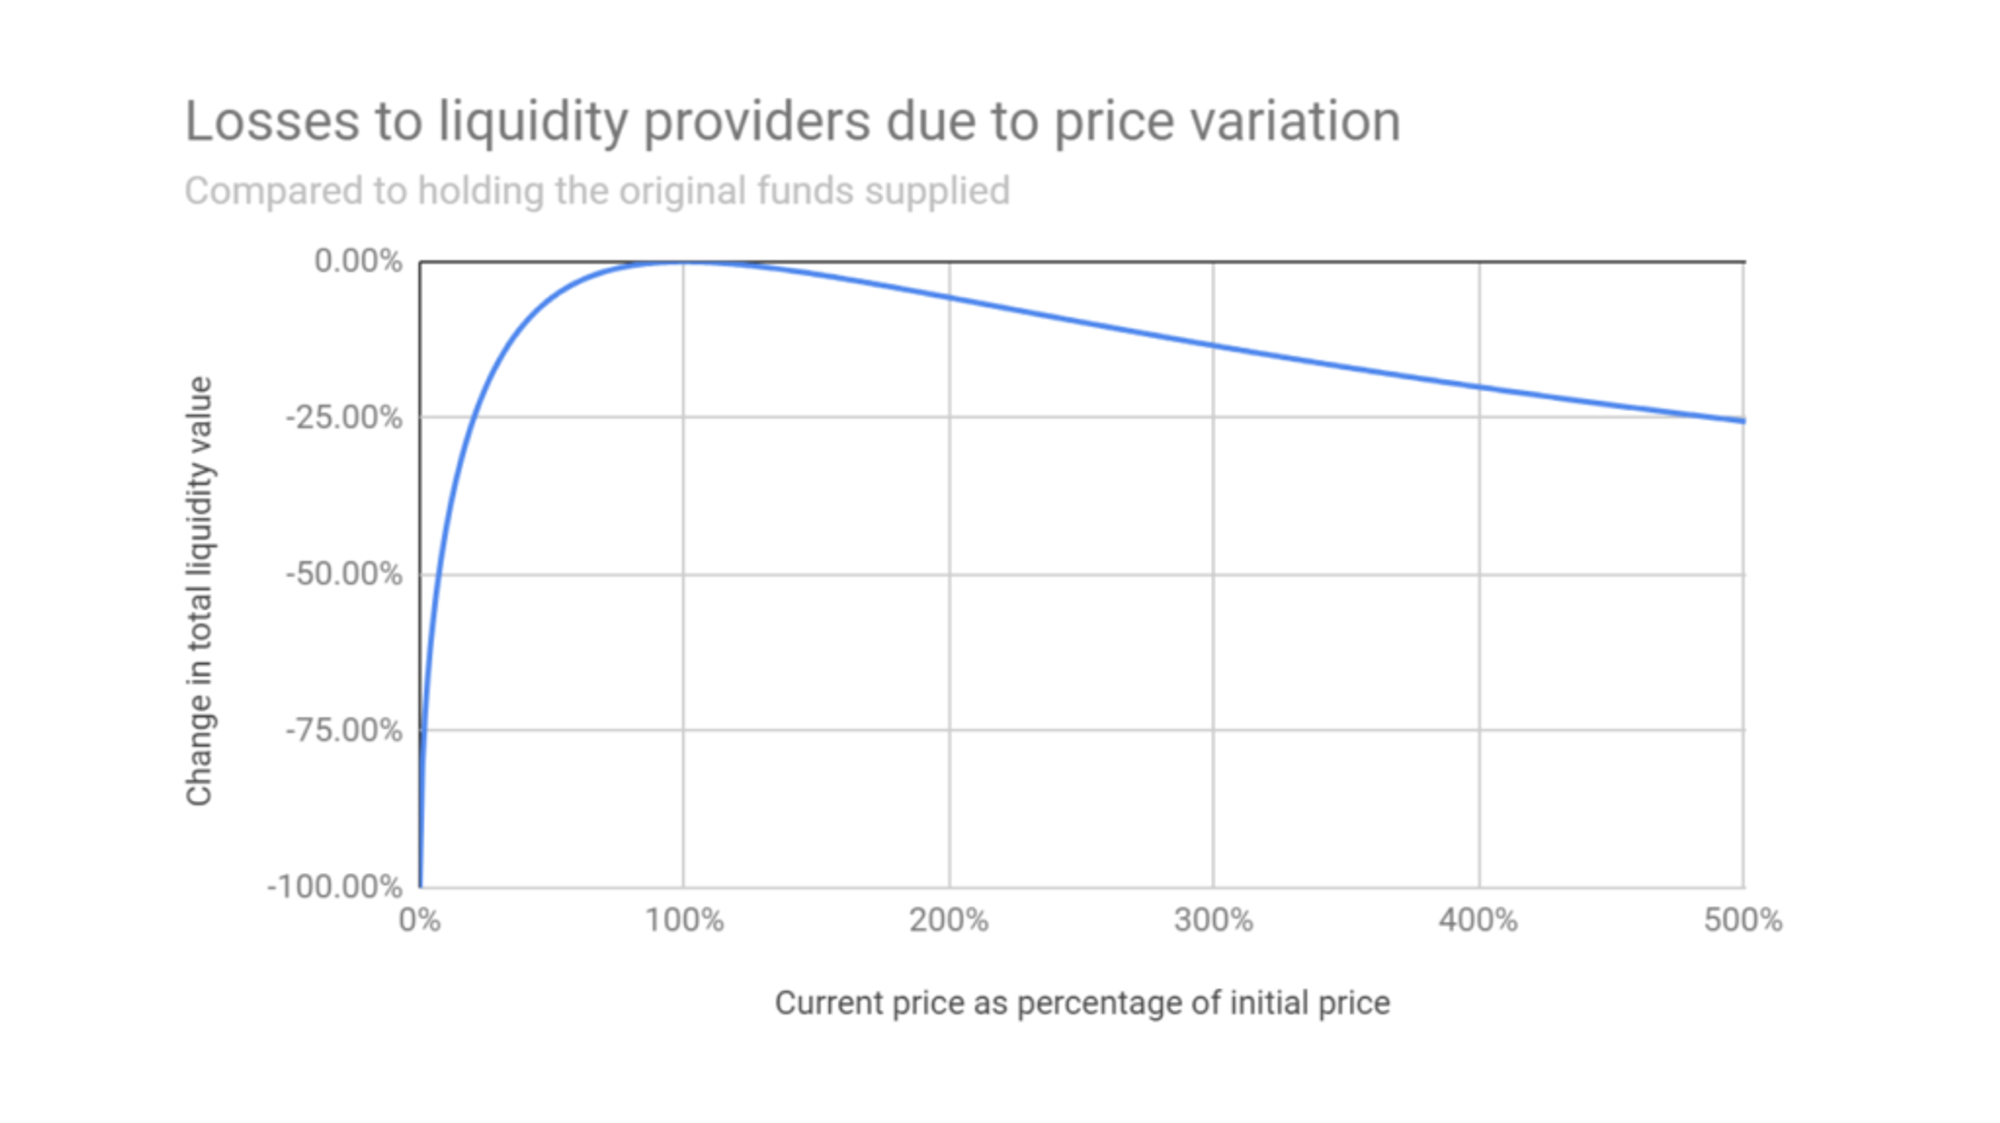
For example, Uniswap has equally weighted two-asset pools (e.g., 50% WETH - 50% USDC). Similarly, Curv’s Tricrypto pool is composed of ⅓ WETH, ⅓ WBTC, ⅓ USD Stablecoin (similar to Clipper’s weights). Both Clipper and these first-generation DEXs provide beta exposure (return attributed to overall market returns) to the mix of assets in their respective pools. However, the similarities end there. Instead of rebalancing as conceived of in Modern Portfolio Theory, first-generation DEXs trade according to the Constant Product Market Maker (CPMM). The CPMM actually generates negative alpha (the return independent of market returns). At best, if prices haven’t moved by the end of the period, the CPMM generates no loss. If prices have moved in either direction, there is substantial loss. This is known as Impermanent Loss. The CPMM generates no profit from short-term volatility and loses money from long-term volatility. Meanwhile, Yield comes not from the rebalancing process but rather from arbitrary fees charged to traders above and beyond the trade price itself.
In other words, Impermanent Loss is not an attribute of all DEXs, rather it is an attribute solely of all CPMM-based AMMs. Conceptually, the CPMM “sells low and buys high” as prices change, which is the opposite of the DRP (and common sense). The below figure shows how CPMMs only account for an asset’s beginning and ending prices. In contrast, DRPs are a function of the specific way prices move in the interim; DRPs profit from volatility.
As you can see, the attributes of the CPMM are not very favorable to LPs. Why, then, is it used by all first generation DEXs? The answer is that it is extremely simple to implement, and it was probably the wise decision at the time to start simple.
Clipper Yields vs. CPMM Yields
Because the DeFi community is so accustomed to DEXs like Uniswap that utilize a CPMM, most advertised APY comparisons for LPs assume the underlying pools are structured as CPMMs, with fees and impermanent loss.
Clipper does not have explicit fees nor impermanent loss. Rather, its trades are dictated by the DRP, which simply accrues value in the pool. This makes it difficult to compare Clipper’s bottom-line LP figures with the top-line revenue numbers most other DEXs use. To ensure full transparency and keep LPs informed, Clipper reports comparable metrics and historical earnings on the Clipper data dashboard.
These metrics include:
- Profit Yield: the sum of the positive difference between Clipper input and output on swaps, according to on-chain price oracles. This figure reflects Clipper LPs' total gains over the given period.
- Comparable APY: top-line yield that includes the impermanent loss avoided by Clipper’s FMM design. These APYs are directly comparable with the APYs reported by most other DEXs (like Uniswap and Sushi), which advertise inflated figures that don't account for hidden costs.
- Avoided Impermanent Loss: calculated by comparing Clipper LPs' gain or loss on a crypto-basis (as opposed to a USD basis) to the crypto-basis loss of the CPMM mechanism used by Uniswap, etc. This crypto-basis loss can be calculated from (and will change based on) the difference in dollar values of the assets at the start and end of the given period.
Nothing in this post is investment advice. Rather, it is a guide to understanding where Clipper’s yield comes from, how Clipper has performed relative to a theoretical benchmark, how that theoretical benchmark would perform in various market environments, how Clipper differs conceptually from first-generation AMMs, and how you can fit a round peg in a square hole to compare them. We hope this post helps you in your journey to do your own research.